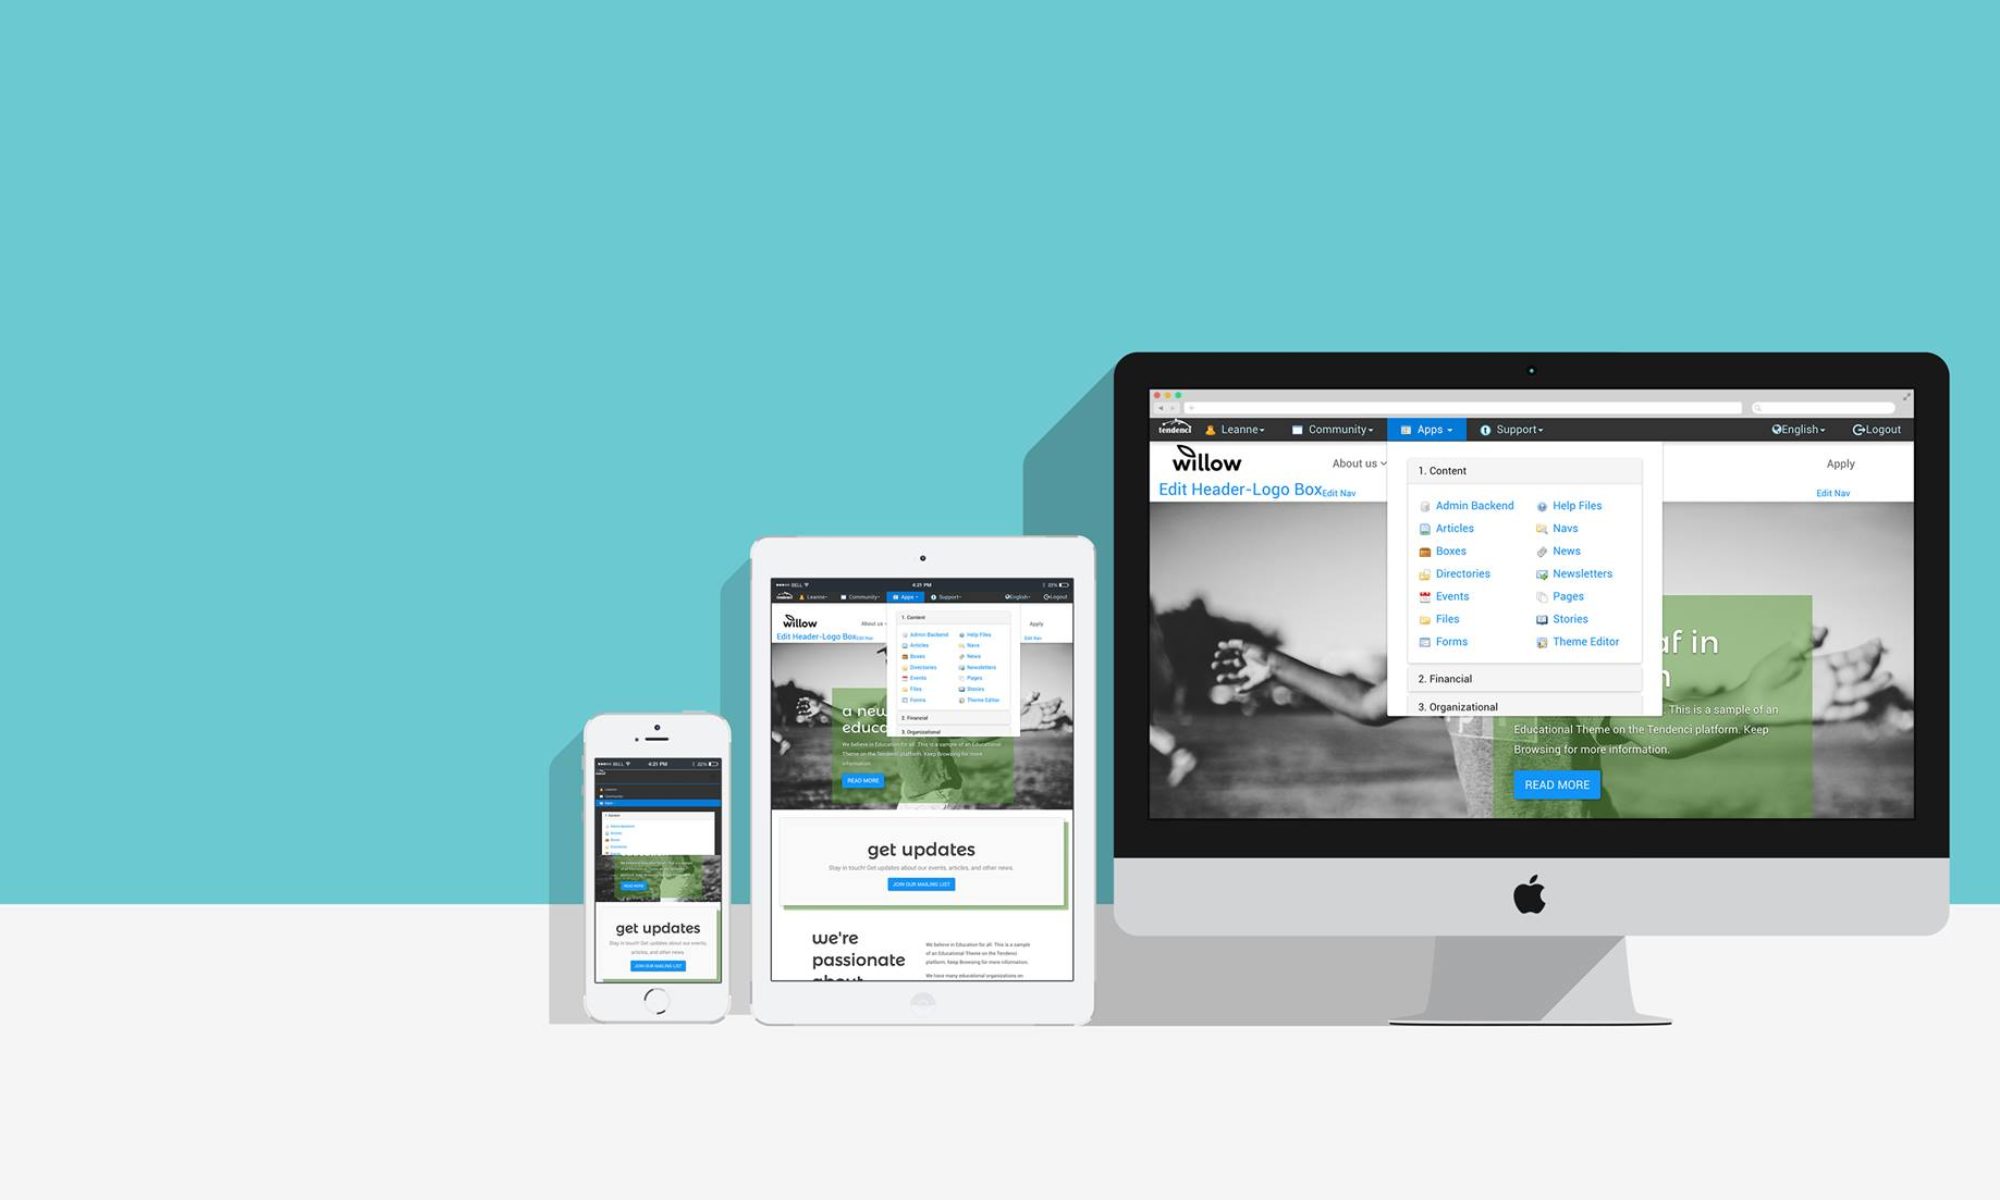
Association Management is really really complicated. Having written an AMS from scratch starting in 2001, successful associations versus unsuccessful associations have some clearly visible patterns. Consulting with association clients on best practices we look at the “online health” of an association. The goal is “how can the association deliver greater value to our membership next year via the mobile responsive boostrap3 framework behind Tendenci Open Source AMS. This has led us to some insights.
One big difference in associations and NGOs is that “episodic nonprofits” vs “nonprofits that have a drumbeat” of events and activity are quite different.
Some organizations have ongoing focus on events and audience outreach. For these organizations we see consistent dip and upflow patters surrounding events and consistent high levels of traffic.
Episodic Event Nonprofit fundraiser example one:
Note most of the traffic below is informational and prior to the event (it was a Saturday event.) And the day before had more overall traffic. A follow up newsletter with photos also generated more traffic than the day of the event.
Photos are the number one element of most sites. If they are not, it is typically because the client isn’t posting photos as opposed to a lack of appeal for a particular industry in my experience. (So go get a DSLR!)
Some organizations will focus on outlets that will reengage audiences post event but not have consistent PR and outreach. For these organizations we see a u-shaped curve around the event followed by a consistent decreased linear pattern.
Episodic event number two:
Note they did a great job of building up a drumbeat before the event and again the traffic is seeking information. This event also saw almost 50% mobile traffic suggesting that users were accessing schedules and maps of the event the day of the event.
Some organizations focus primarily on event based engagement. For these organizations we will see steady curve upwards leading up to the event, followed by a drop off.
Modules used by many of our non-profits are partially listed in the menu screen grab below. Note that this is a partial list and varies by client.
This legend explains the correlation between the colors which are the same universally for all Tendenci clients. I blurred the numbers but all of the charts are scaled to print. So 1,000,000 events, if that is the max in a given module will be the same height on the reports as 1,000 events on a smaller association or NPOs site. This is just to help explain it.
For more on Tendenci and how it can help your non-profit, visit www.tendenci.com. It is also completely open source so feel free to try the demo at http://demo.tendenci.com and developers can download and extend it at www.tendenci.org .
Ed Schipul is the CEO of Tendenci and will be speaking on Data Analytics at NTC 2014 in Washington DC on March 15th (Online Fundraising Strategies to Take Advantage of Your Donor Events)


